
By AQR Capital
Value Spreads:
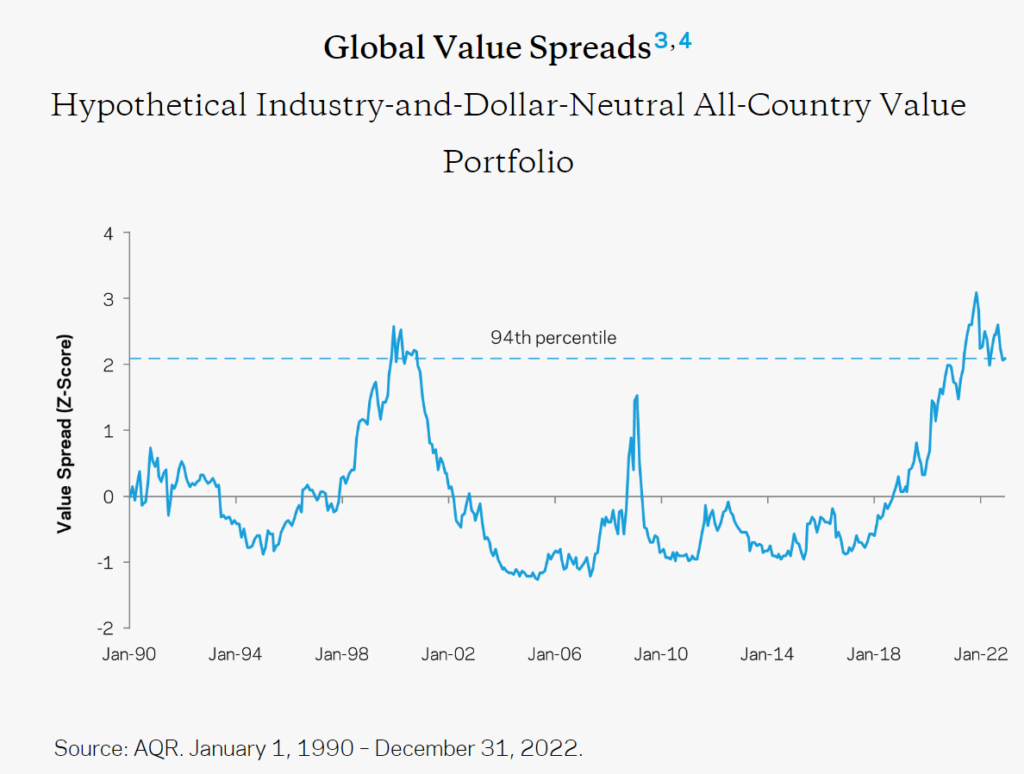
Value Spreads Are Back to Tech Bubble Highs: Is Everyone Out There Cray-Cray? (1)
August 05, 2022
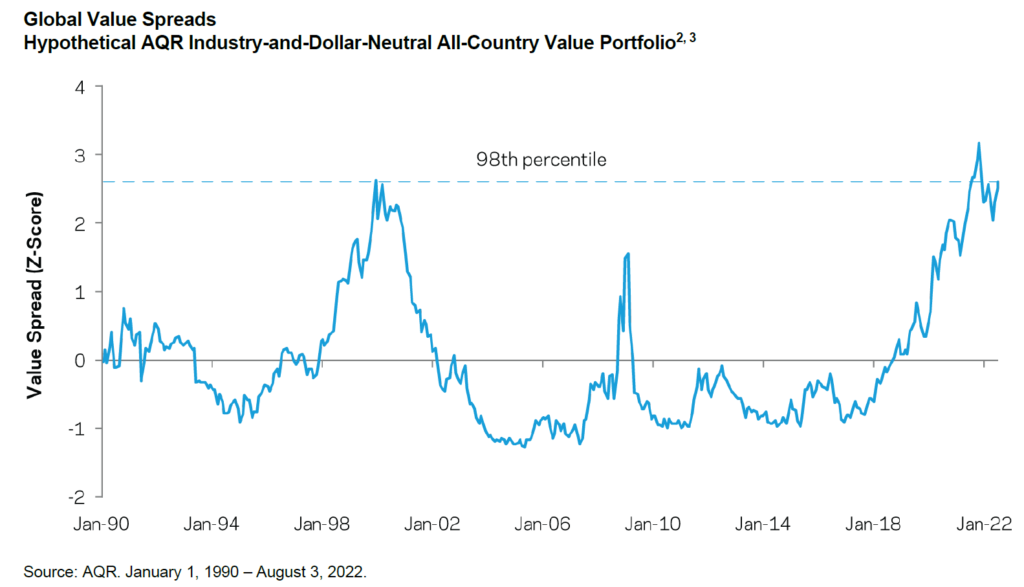
(1) This adds another three months of data to the May entry in our series of value spread updates. Over the past two months, some portion of the market went temporarily (I hope) insane, punishing value, as we measure it, to the point where the value spread has retraced much of its modest narrowing (at its intra-year low, the value spread was still around the Tech bubble peak, but now we’re fully back to it!) since the beginning of the year. Returns on value are still strong YTD (they’ve done better than you’d guess from looking at these spreads). But not as strong as they were. The past couple months serve as a cruel reminder that a massive valuation dislocation says very little about the timing of when it falls back to earth (we’ve never claimed otherwise, just that it does fall back to earth, and often at the times your portfolio needs the most help!). The world doesn’t steadily move a little bit towards what we think is rational each day – it’s not a linear process. But this changes nothing about our belief in the very positive outlook for value, and wider spreads make us a bit more excited than before.
2. Spreads are constructed using a hypothetical AQR value composite that includes five value measures: book-to-price, earnings-to-price, forecast earnings-to-price, sales-to-enterprise value, and cash flow-to-enterprise value. Spreads are measured based on ratios and are adjusted to be dollar-neutral, but not necessarily beta-neutral through time. To construct industry-neutrality, the value spreads are constructed by comparing the value measures within each industry. The all-country universe is based on roughly 85% developed / 15% emerging weights, derived based on proprietary ex-ante risk targets as of 7/31/2022. The developed data starts January 1990, while the emerging universe is included starting December 1994. The risk models used are the Barra Developed Equity Risk Model and Barra Emerging Equity Risk Model. Hypothetical data has inherent limitations, some of which are listed in the Disclosures. For illustrative purposes only and not representative of an actual portfolio AQR currently manages. Please read the Disclosures for important information.
3. Over the last few years, we’ve calculated the value spread various ways in these blogs. Sometimes just in the USA. Sometimes using only one measure like P/B when we want to go really far back in time. What we present here is the closest yet to how we actually view value and represents the value spread we look at most often in making decisions about tilts and the like. Other variants may differ somewhat.
Also read:
The Bubble Has Not Popped (1), (2)
Clifford S. Asness
October 24, 2001